
Cache effects in object-oriented code: computer architecture meets programming
A simple demonstration revealed five layers of computer science & engineering abstraction fighting each other


Having worked in robotics research and industry for over a decade, I’ve debugged enough real-time control loops to know that the programming language abstraction can be misleading. We write object-oriented code because it’s maintainable, composable, and maps cleanly to our mental models. A robot has limbs, limbs have joints, joints have positions and velocities, so we should create a hierarchy of objects accordingly, right?
When battery life is crucial, and when microseconds matter to ensure control loops remain stable, the hardware doesn’t care about elegant class hierarchy or beautiful code. The end-product of programming is data transformation, and not the code itself.
This post, written with my friend Greg Anderson (software engineer and CS lecturer), started as a simple teaching example about Array-of-Structures vs Structure-of-Arrays (AoS vs. SoA) layouts. We thought we’d show a clean and universal performance curve demonstrating cache effects tied to C++ code.
We built what seemed like a straightforward benchmark: measure access time for different memory strides. What we didn’t anticipate was encountering five distinct issues spanning multiple abstraction layers—from compiler behavior to microarchitecture to hardware characteristics:
The compiler deleted our measurement code and unpredictably stored variables in memory vs. registers
The CPU’s pipeline hazards dominated our memory access time
The CPU’s dynamic frequency scaling skewed our results
The hardware prefetcher made our predictions wrong
Different processors gave wildly different results
This illustrates the gap between abstraction and performance. Programming languages provide abstraction above the hardware, but achieving good performance requires understanding how code executes on the underlying architecture. While some of our issues may be familiar to experienced programmers, others might be surprising even to veterans.
Four examples showing why you should care
There are many real-world examples using an "array of structures" organization for good reasons: it's faster to prototype, easier to reason about when objects manage their own state, and typically more readable for developers.
Example 1: PCL (Point Cloud Library) PointXYZRGB structure.
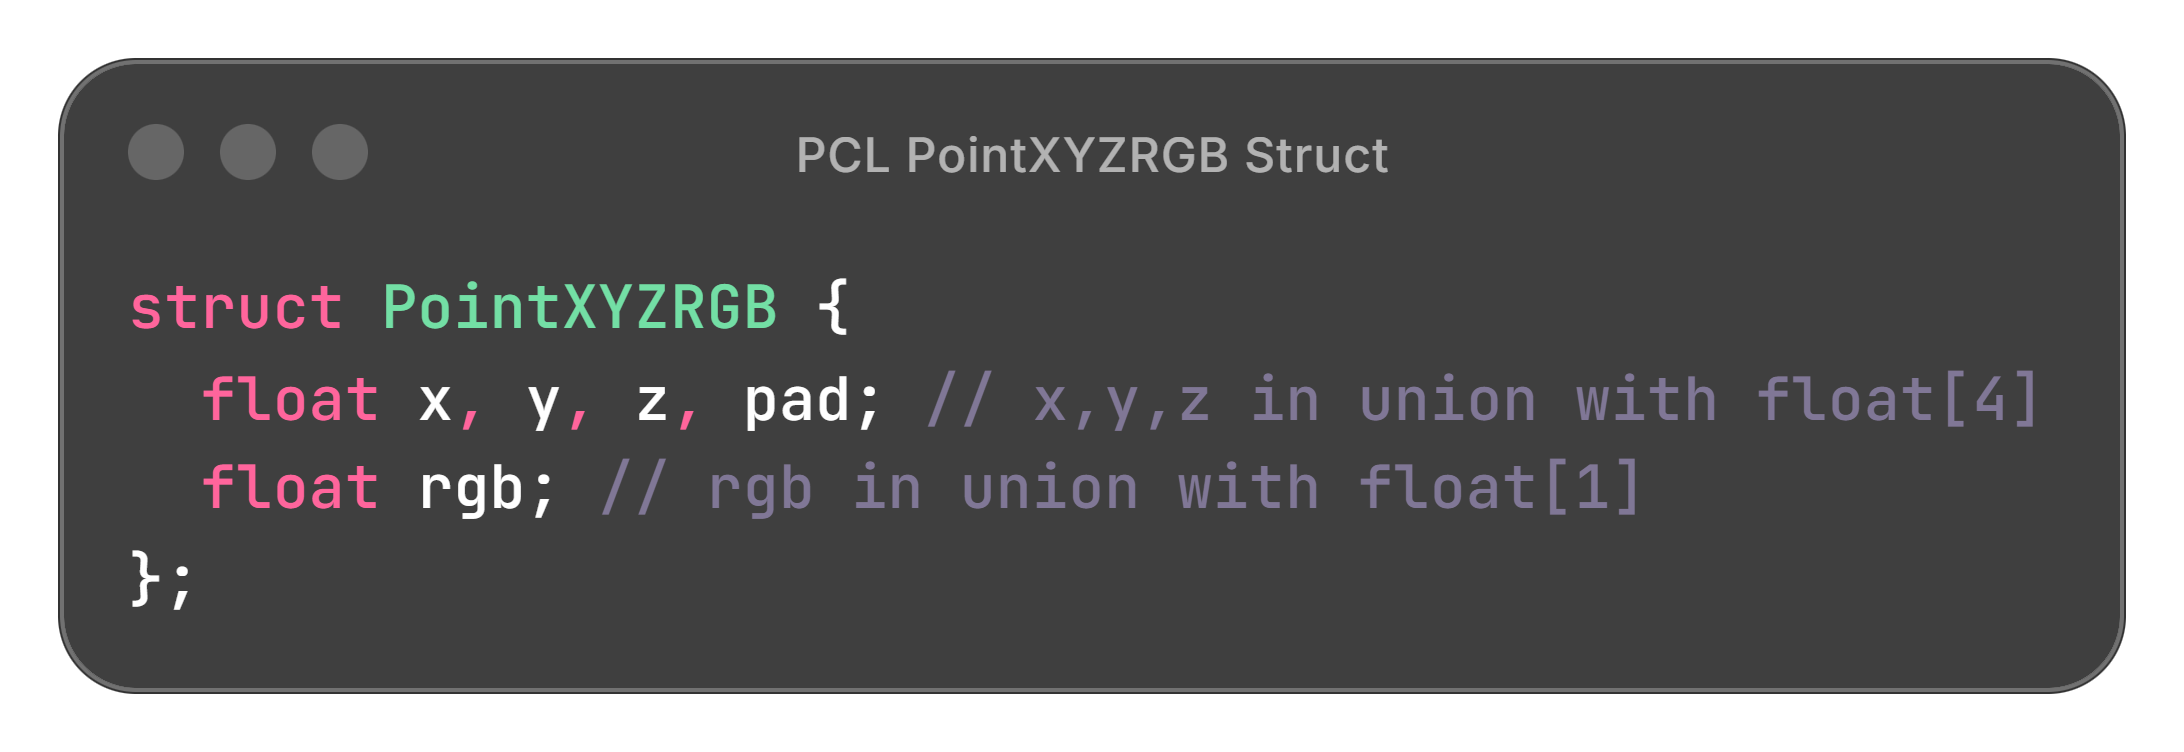
When you have pcl::PointCloud<PointXYZRGB> with millions of points, the memory layout looks like
[x0, y0, z0, pad, rgb0, x1, y1, z1, pad, rgb1, ...]For an example task of filtering by distance (operating on the xyz only), we get 40% extra cache misses. For a color segmentation task operating on rgb only, 4x extra cache misses.
Example 2: Unity GameObject-Component System. GameObjects directly contain Component instances by value, e.g. a GameObject with Transform, Rigidbody, and Collider components stored as member data. This is classic AoS: each GameObject owns its component data, providing flexible composition but poor cache locality when iterating over many objects.
Example 3: Box2D (version 2.x). Each b2Body contains position, velocity, and force data as members (e.g. b2Vec2 m_linearVelocity). Most traditional object-oriented game engines before the ECS trend used composition with value semantics—each enemy/player/NPC object contained all its data directly. However, Box2D v3.0 (2024) moved away from this, now using handle-based IDs and storing body data separately for better performance.
Example 4: Humanoid joints. Last but not least, here is a practical example of a humanoid robot joint that should be quite relatable:
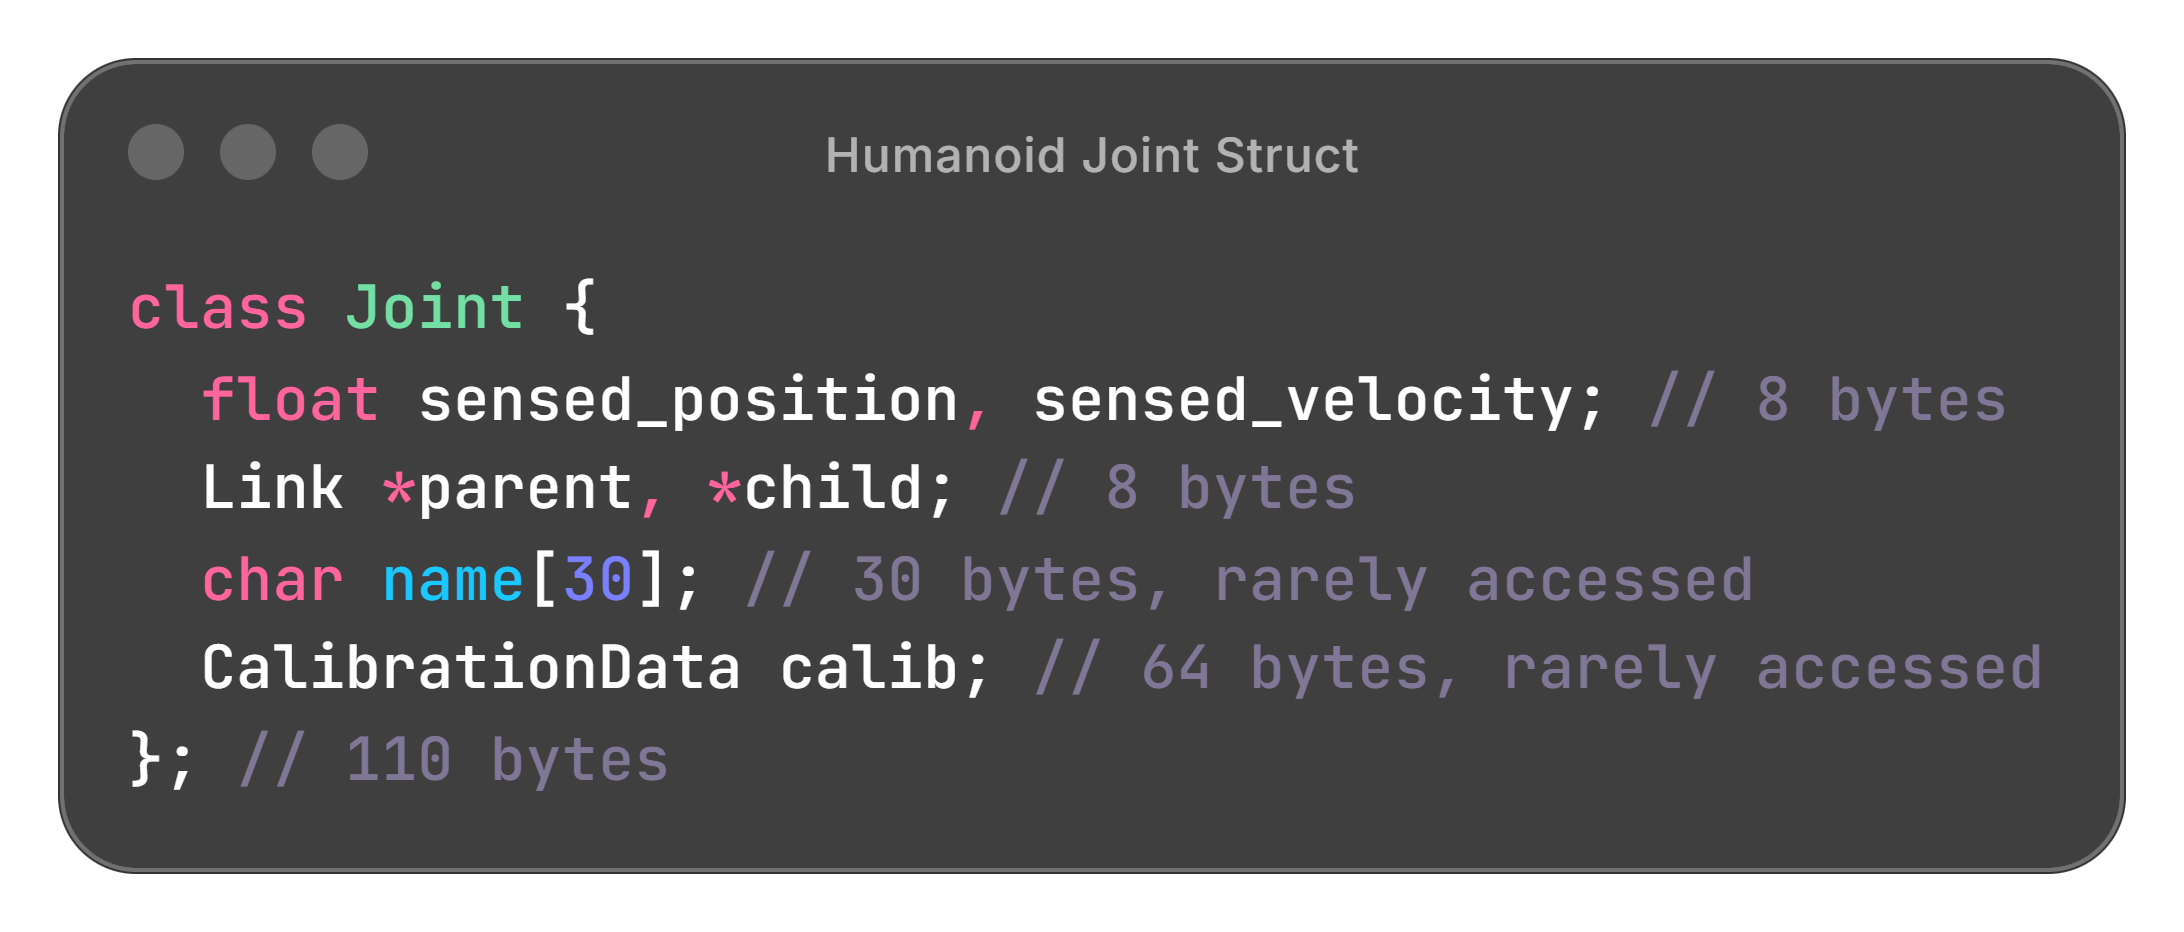
A Limb would be composed of Joints, with Joint specialized into different joint types.
Suppose the humanoid robot has 50 joints. Computing Jacobians requires accessing each joint’s position: 5.5kB loaded into cache (87 cache misses), when we only need 200 bytes (4 cache misses if organized as an array of positions).
Now that we have shown that this organization occurs commonly, we will dig in and try to measure the effect it has.
An even simpler example to dig into
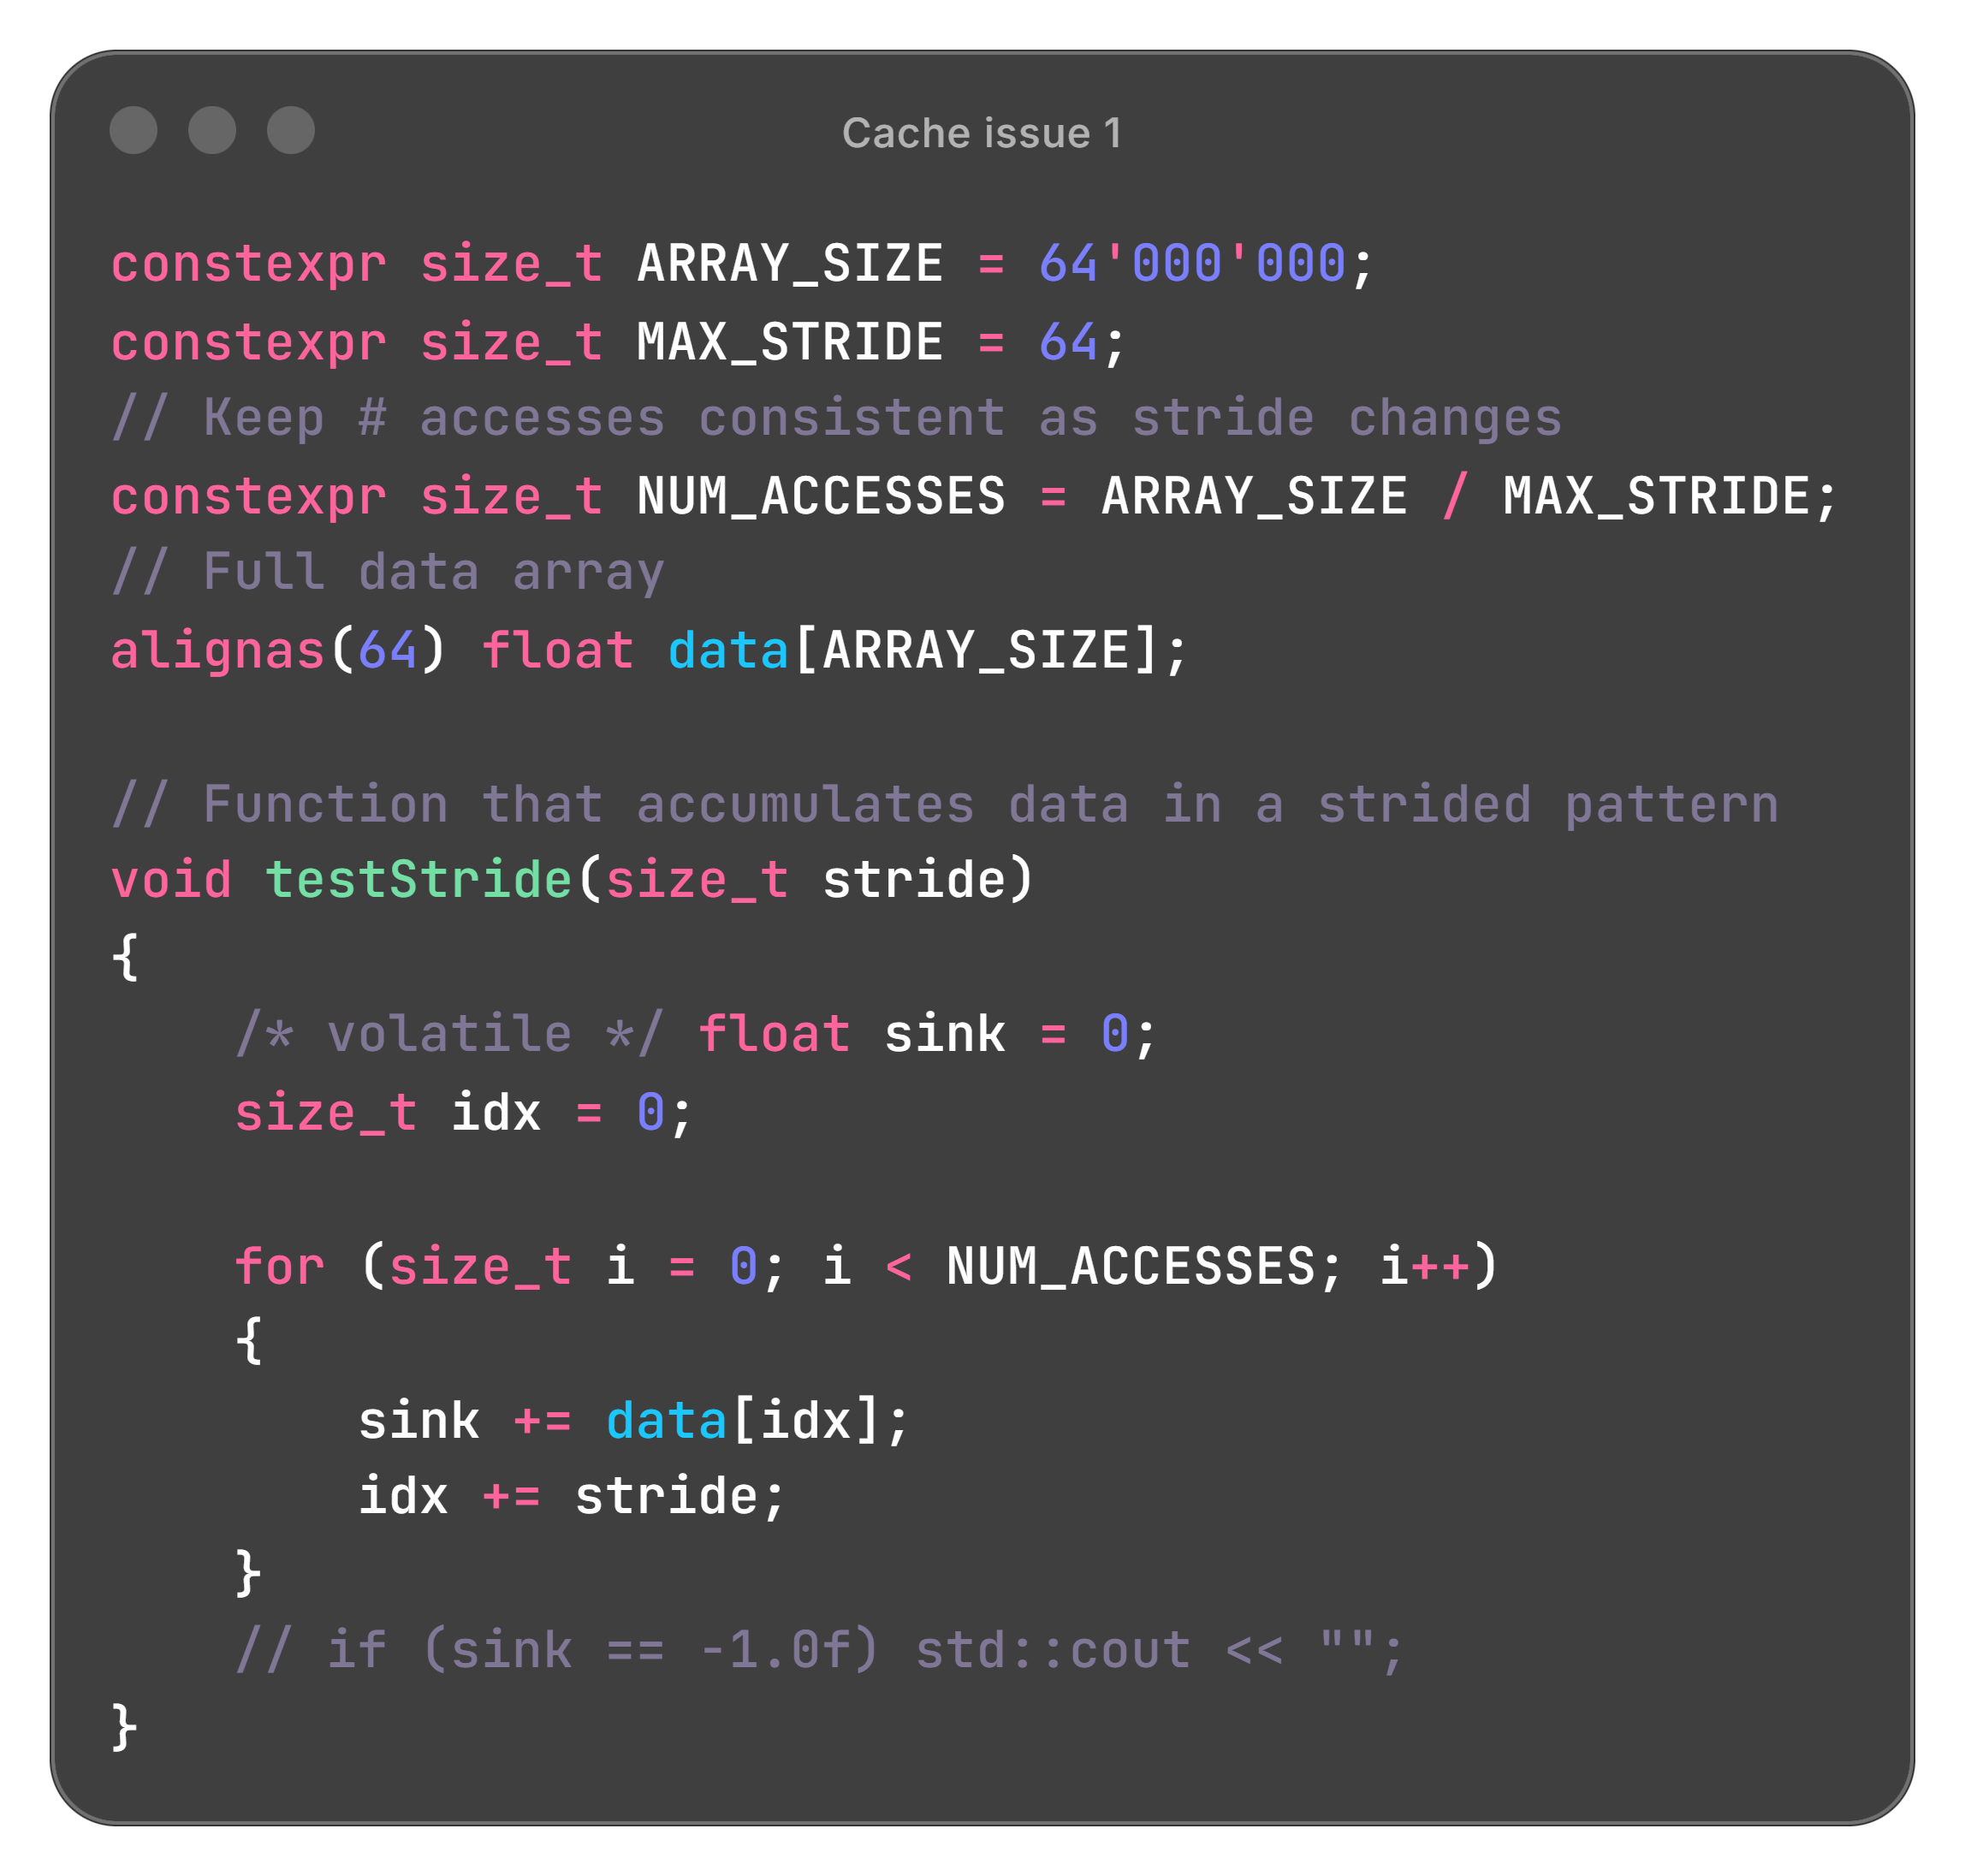
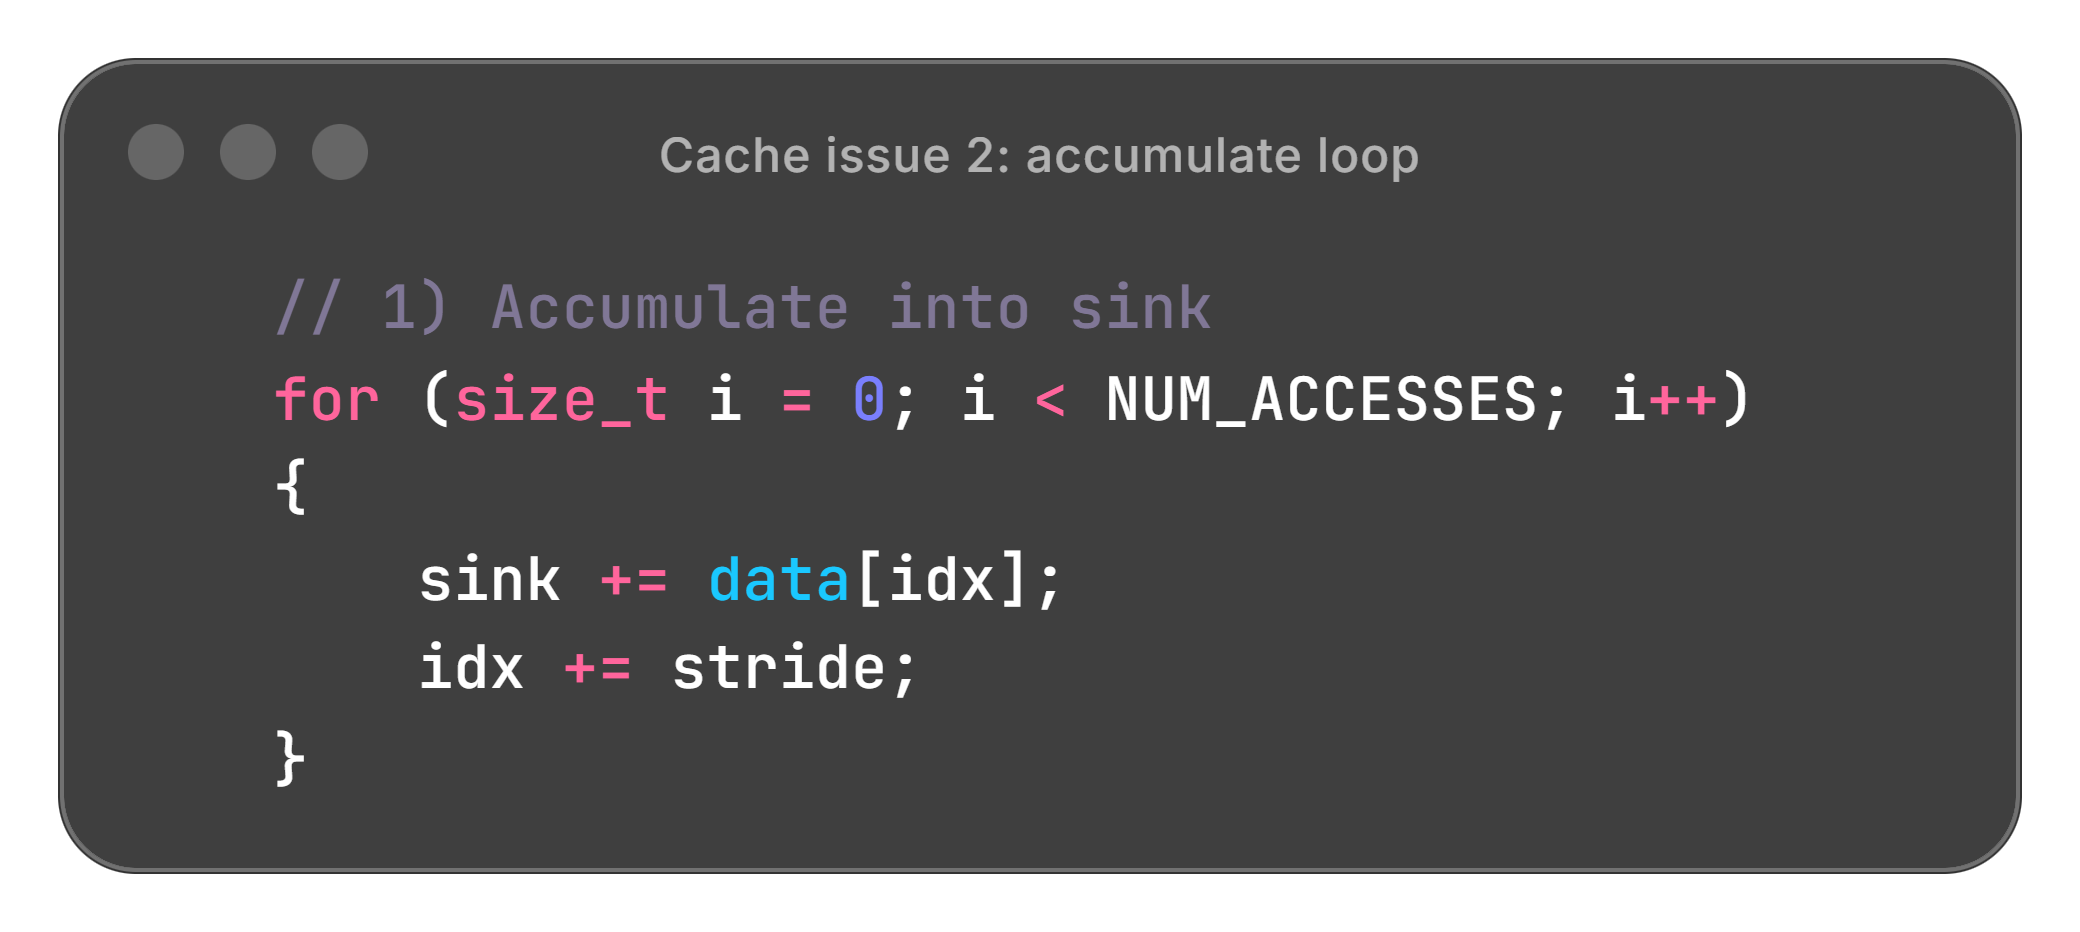
We created an even simpler example with a single data array and a parameterized “stride” for a strided access pattern. This would occur in the example above with stride = sizeof(Joint). Our goal was to time how long it takes to access a fixed number of elements with different strides, as in the code below.
The actual code for replicating all these measurements, and more, is on github: feel free to try it out.
What we expect to see: Effectively, as we access data, the processor can load a segment from main memory into cache, in blocks.
Data:    |x| | | | |x| |...
          ← stride →
Cache:   |y|y|y|y|y|y|y|y|z|z|...
          ← line size  →
As stride increases, visiting the same number of elements requires caching more blocks. If memory movement dominates, we expect a linear rise in time as stride increases and more cache lines are touched. (More on what happens after each access hits a separate cache line below.)
Understanding the results from this "simple" example felt like peeling endless layers of an onion, but was very gratifying at the same time!
Issue 1: Controlling compiler optimizations
With the code snipped above, the assembler output showed:
testStride(unsigned long):
        ret
data:
        .zero   256000000
Of course! sink was being optimized out, and my firmware programming background caused me to add a volatile to its declaration. However, something in the asm output for the loop looked amiss. Can you spot it?
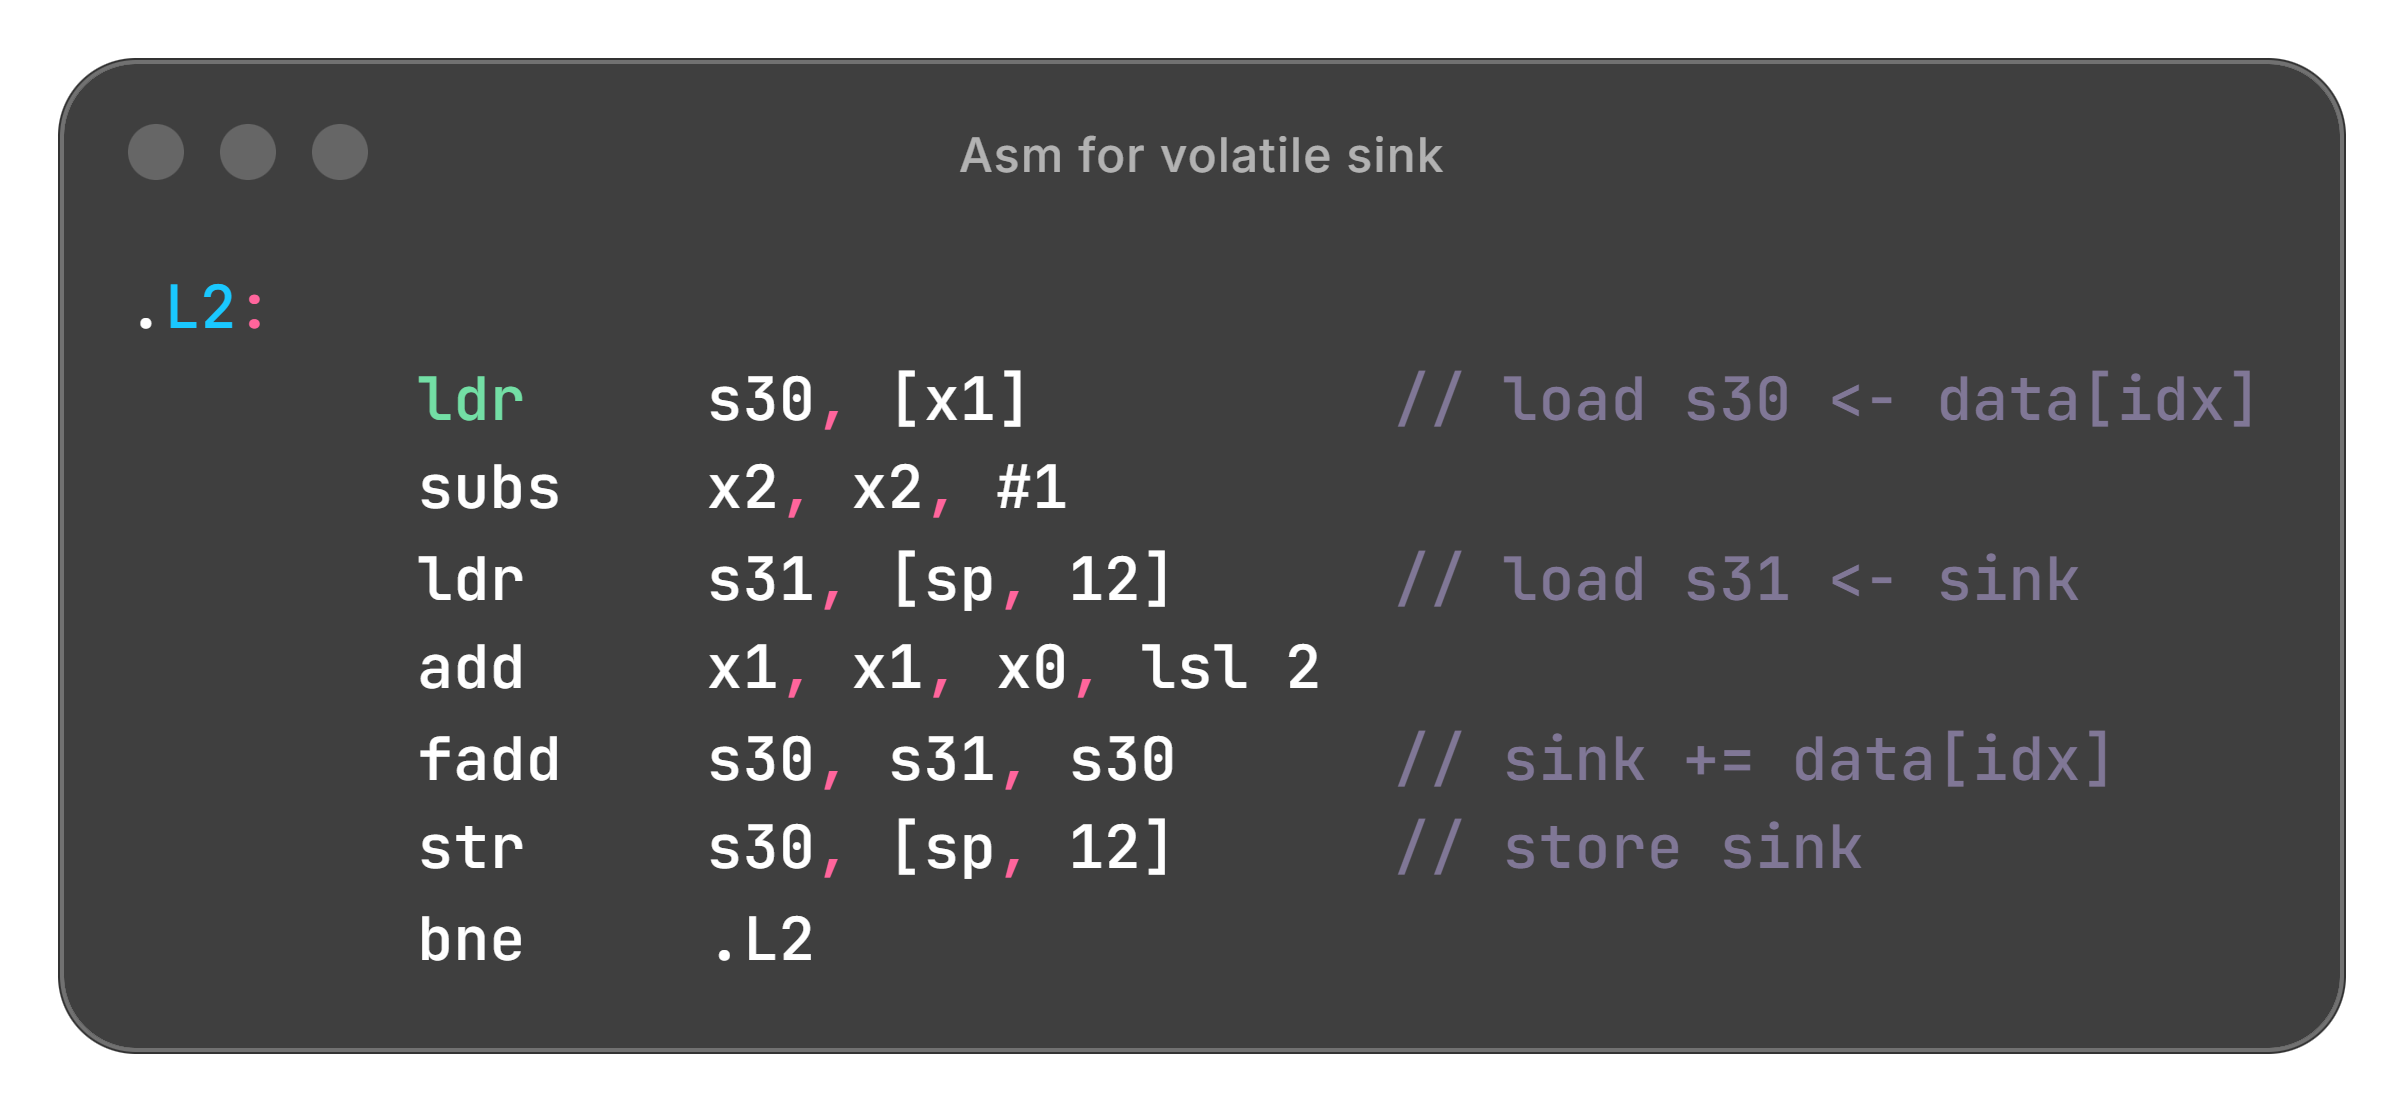
While data should be loaded from memory to a register, sink should be able to remain in a register. However, volatile forces it to be loaded and stored because the compiler must assume that it can be modified externally. So we get rid of volatile, and uncomment the last line:
if (sink == -1.0f) std::cout << "";The new loop looks like
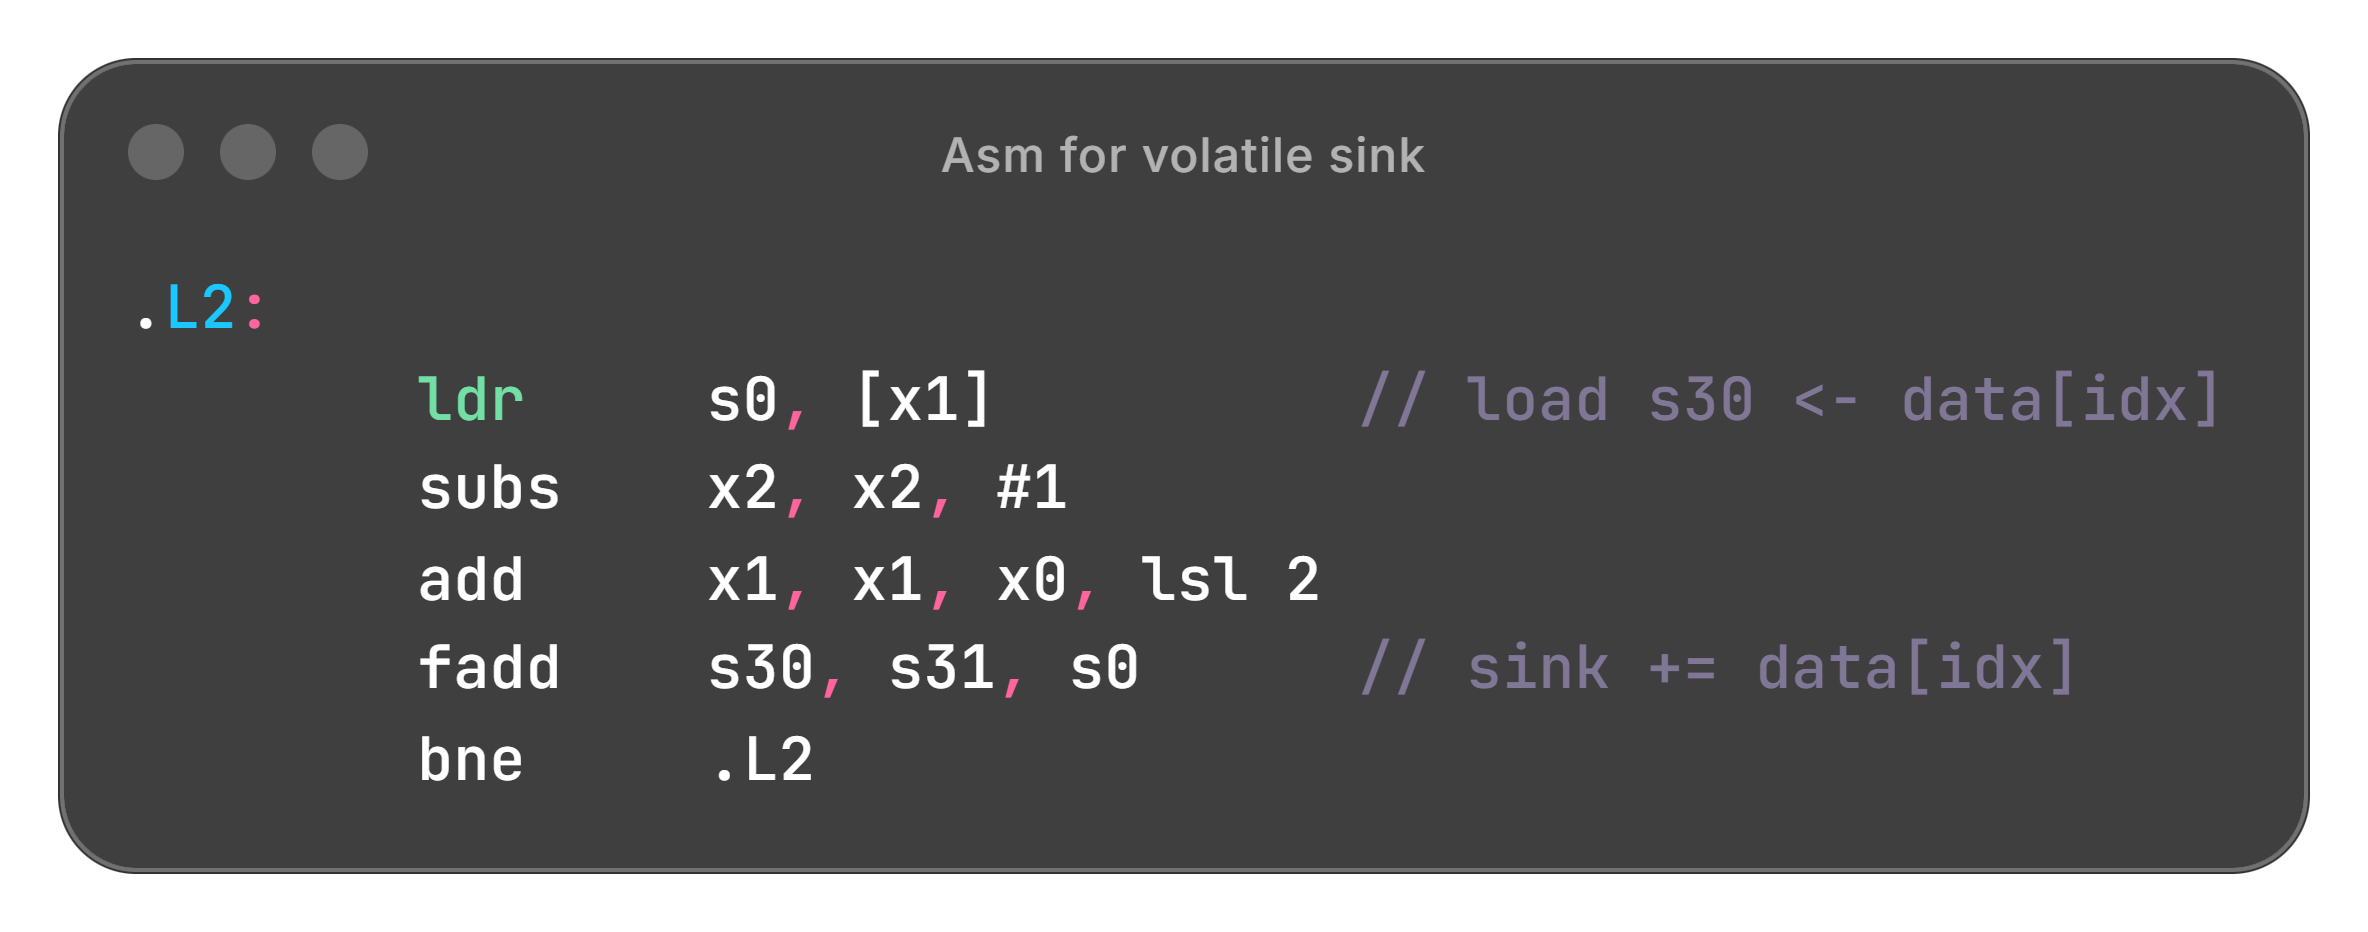
Comparing to the assembly above, the extra load-store are gone - first mystery solved.
Issue source: compiler / programming language
Issue 2: Data dependency hazard
The relevant part of the loop looked like this:
Timing this loop as we varied stride showed that for the first few strides, increasing stride had no effect on the time (solid lines in the plot below). With an Apple M2:
With the size of our loop, increasing stride definitely means more cache lines are touched, but it is making no difference. What’s going on?
Let’s look back at the assembly (same as the previous snippet).
If we manually unroll a few iterations, we have the following pattern:
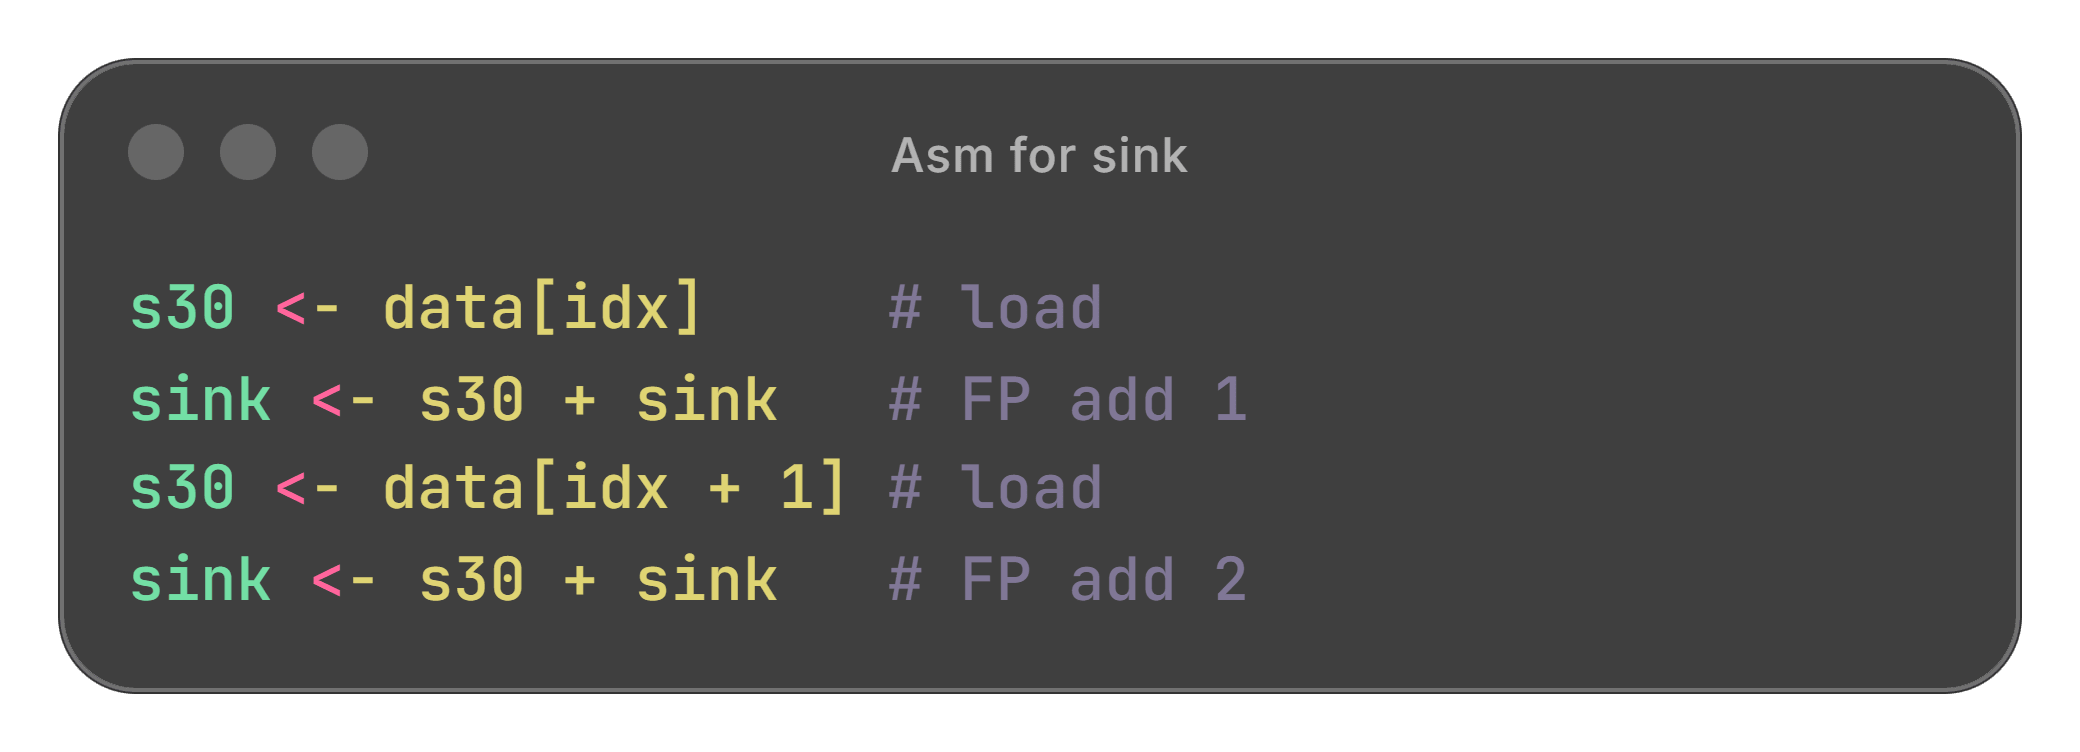
FP add 2 cannot issue until FP add 1 has been committed, a classic Read-After-Write hazard. While a chip designer understands this very well, a programmer rarely needs to understand data dependency hazards in CPU pipelining. In this example, the float add dominates the effects from the load/store due to the data dependency and the long latency of floating-point add.
We add an unrolled version:
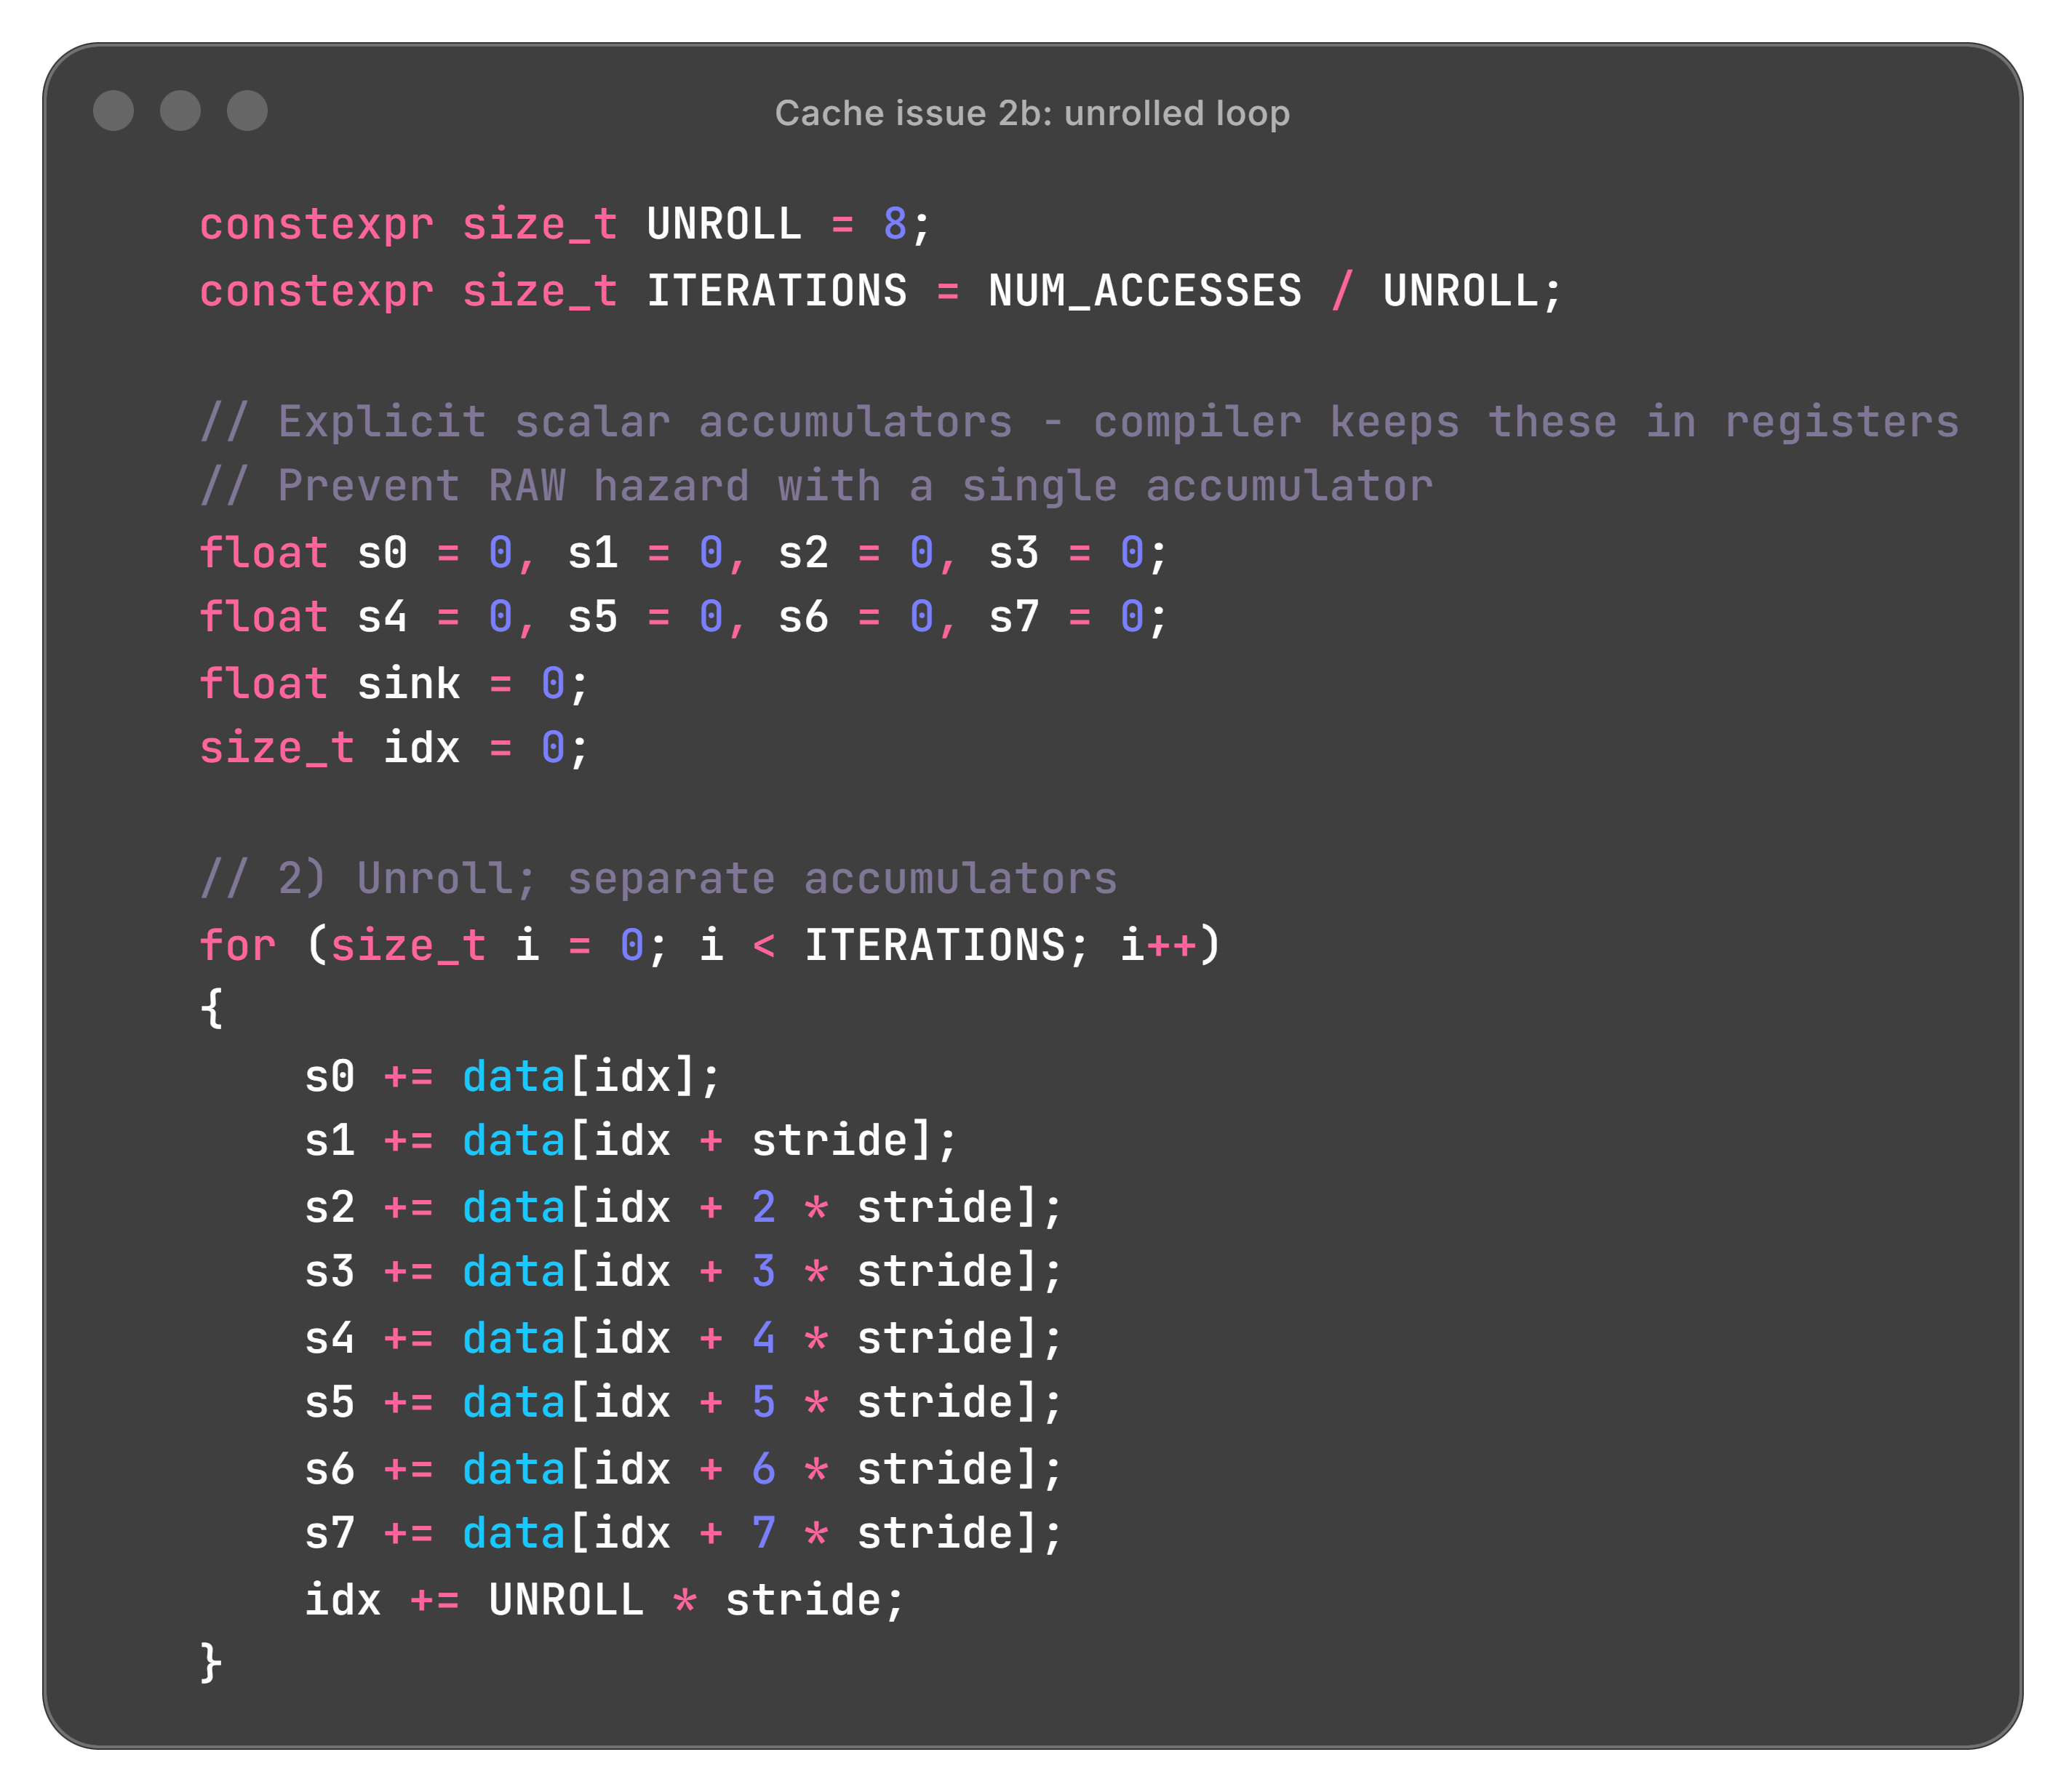
The unrolled version time is significantly smaller, as visible in the dashed lines in the plot above, and more importantly, now we see the linear rise we had predicted.
Issue source: microarchitecture, not visible in assembly instructions
Issue 3: Warmup effects
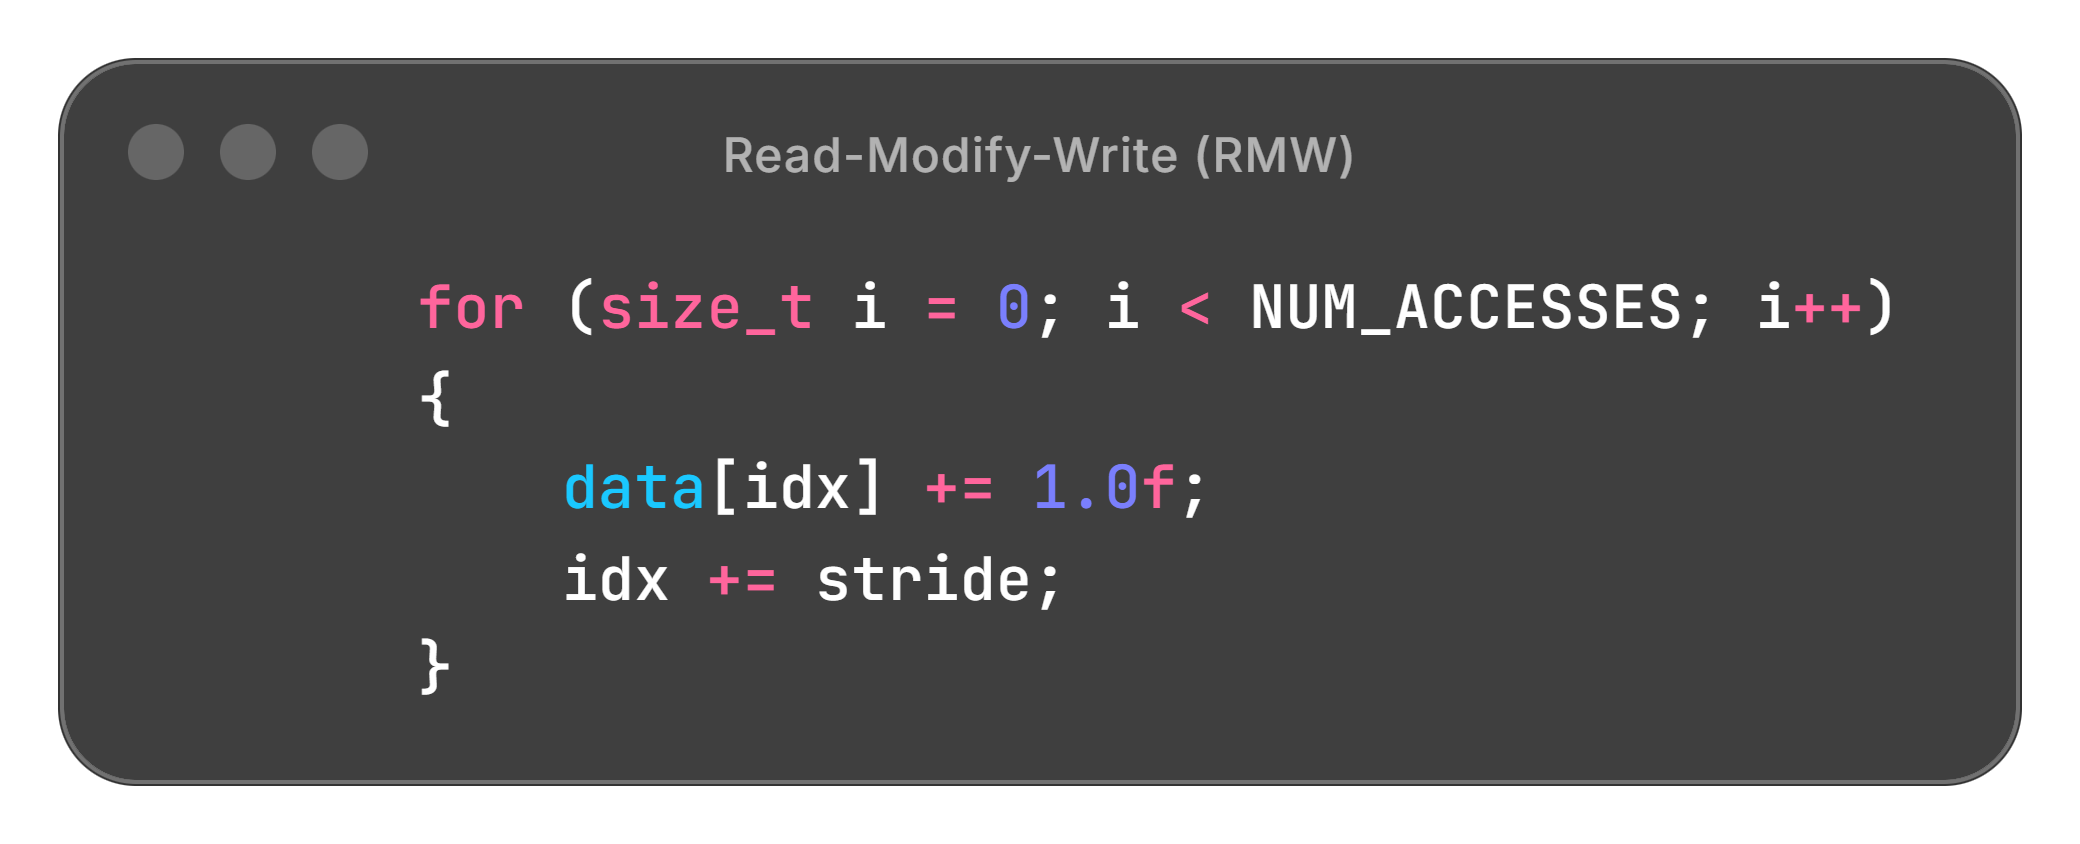
After root-causing issue 2, to avoid dealing with the unrolled loop, we changed the accumulate to a Read-Modify-Write. The time for each iteration is now longer because a load and store are required for each iteration, which should make data movement costs the dominating factor.
A number of stateful microarchitectural effects unrelated to the data cache contribute to performance characteristics, yet produce data cache-like behaviors. Such factors may include page table caching, page walk caching, prefetcher training, the memory controller, and even frequency ramping.
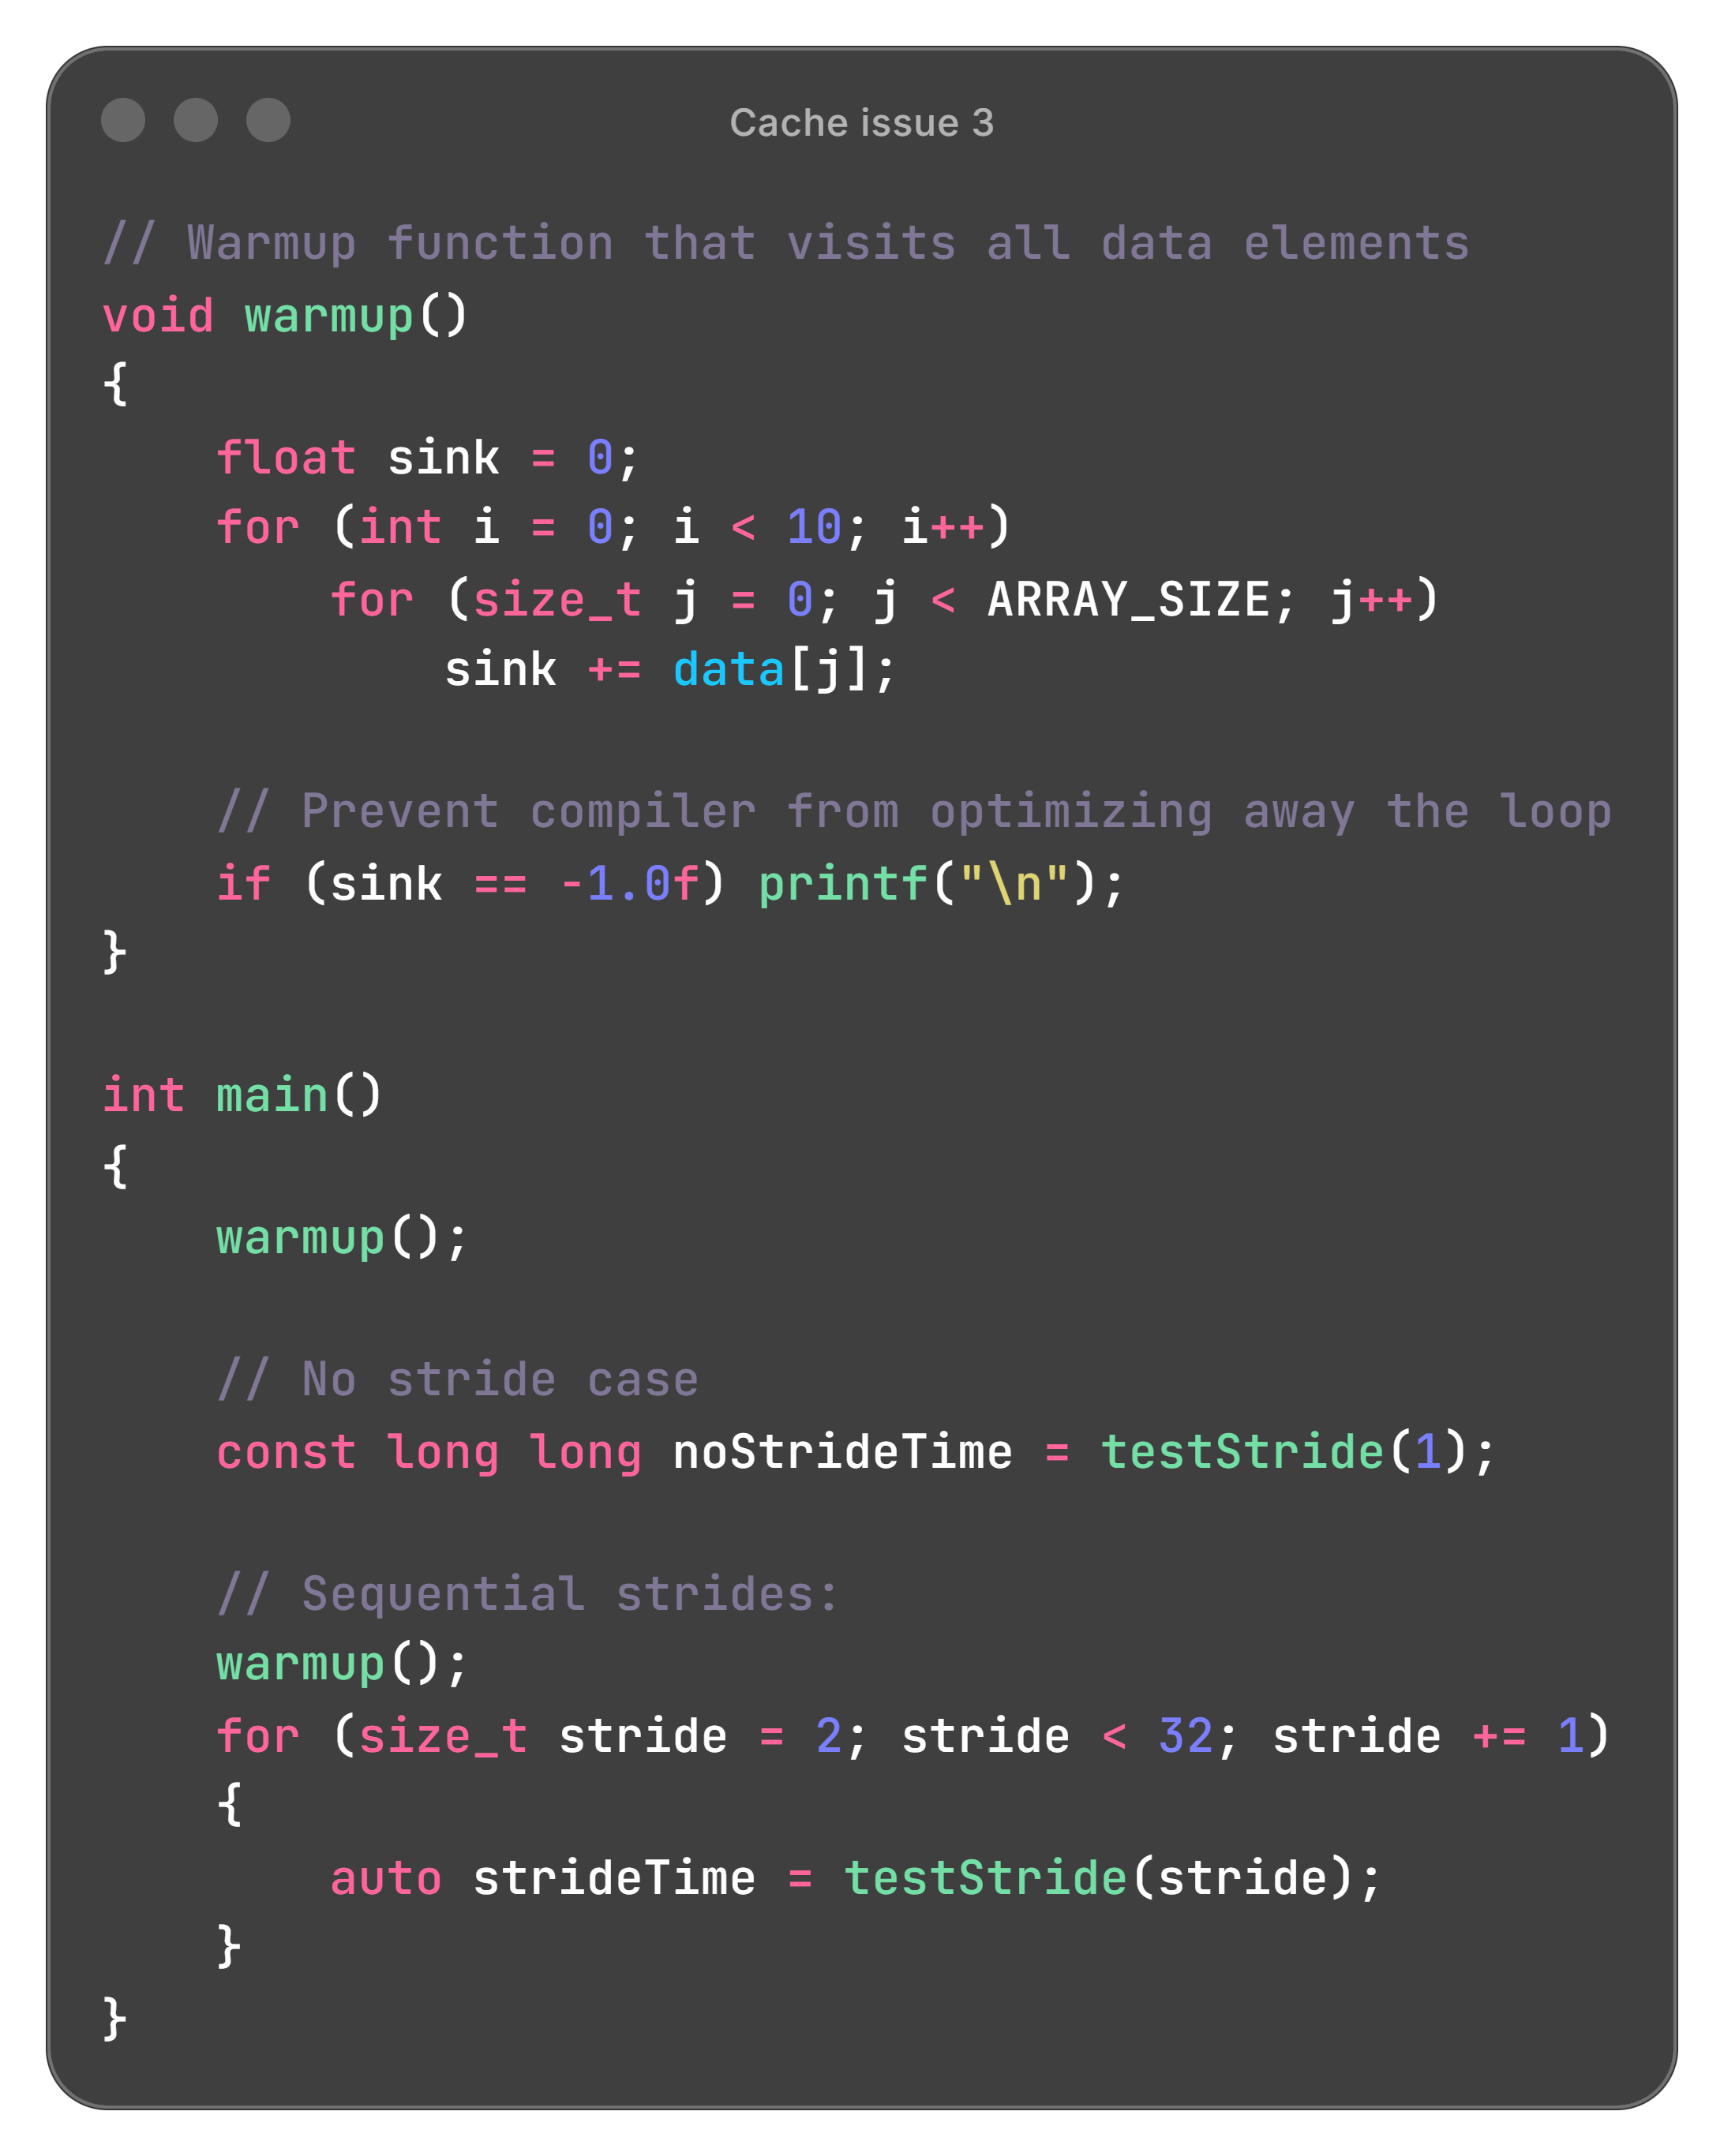
We attempted to stabilize the effect of these factors before running trials by running a warmup function at the beginning of the program. The warmup simply iterates over every element of data once to have the cache in a predictable state.
The results:
The warmup appears to universally make the program faster, irrespective of the stride (more pronounced effect on a different system in plots below). Our best guess is that the warmup ramping up the CPU frequency is the dominant effect. We also considered a trial for one stride affecting another, but running a single stride per run of the program didn’t yield clearer results (and took much longer).
Again, if you have any better ideas, we would love to know - please leave a comment!
Issue source: microarchitecture / hardware
Issue 4: Initial no-effect; second slope after cache line boundary
4a) In the previous plot, there is an initial part till about stride ~5 (20 bytes) where we predicted a linear rise, but instead see no effect of stride on timing.
While we are not sure, this is likely due to hardware prefetching: Modern CPUs have hardware prefetchers that detect sequential / strided access patterns and automatically fetch data ahead of time. Once the stride grows large enough (~20-64 bytes), the prefetcher can no longer keep up—either because it can’t fetch far enough ahead, or because the access pattern becomes too sparse for it to predict. At this point, we finally see the expected linear increase as each access genuinely waits for data from main memory.
4b) We expected the access time to plateau after each access was already hitting a different cache line. However, there appears to be a slower rise after the cache line boundary at least on the Apple M2 processor
Some (unconfirmed) hypotheses for the slower rise after the boundary:
L1 → L2 spilling if the working set exceeds L1 capacity, incorporating L2 access times
TLB misses as large strides access many different memory pages
Issue sources: microarchitecture / hardware
Issue 5: Different behavior on different processors
Throughout uncovering the previous issues, we ran a few tests on other processors, and unfortunately that only served to increase the number of unknowns. In this section we will show you some of those results, but only be able to speculate about what causes them.
With an AMD Zen5 processor:
We see a plateau after an initial rise, which matches our naive prediction.
However, we observe a peak around 32 floats (128 bytes) followed by a drop. We don’t have an explanation for this behavior, which may be to do with advanced prefetcher behavior. In other words, the hardware may be making assumptions about our access pattern, and stride = 64-128 bytes hits the worst-case scenario where those assumptions fail. If you have any ideas about the cause, let us know in the comments!
We also tested on an Intel processor on Windows, which confirmed that some of the strangest aspects of the two plots above are to do with AMD, and not the compiler.
This resembles our Apple M2 plots more closely, including the slower rise after the cache line boundary. It also adds an even slower rise after 2x the cache line boundary.
Issue sources: secret microarchitectural optimizations
Back to programming
Through this journey, it is safe to say we learned a lot about the complexity of modern processors. Fortunately, though, our central point about the (initial, then plateauing) rise of access time with stride still stands as universally true. Phew!
How do we utilize this knowledge as a programmer? The key is to ensure that commonly-accessed data is packed tightly in contiguous memory.
The naive OOP concept of owning data:
The class directly contains/owns the data as member variables
Example: Joint class with float sensed_position (and other things) embedded in it
This creates the AoS memory layout problem
Instead store indices. In the literature on data-oriented design, this is sometimes called: Entity-Component-System (ECS) pattern, or data-oriented design with handles.
The class contains references, pointers, or indices to data stored elsewhere
This allows you to keep polymorphism while avoiding AoS layout issues
It isn’t object-oriented vs. polymorphism. Just to reiterate that data-oriented is not opposed to OOP conveniences, consider that Pinocchio uses polymorphism to specialize functions, but stores indices to the vectors, not the data itself. The actual positions and velocities live in contiguous arrays, giving cache-friendly SoA layout, while the polymorphic joint models provide the OOP interface. You can have the benefits of polymorphism (different joint types with specialized behavior) without the memory layout problems of AoS. This is the middle ground between pure OOP with composition and abandoning OOP entirely for data-oriented design.
Closing thoughts
In this post, we first showed how OOP-thinking can naturally lead to suboptimal cache usage, with several real examples. Then we looked at the effects this can have, uncovering many interesting “side-quest” root-causing exercises.
It isn’t coincidence that modern performance-critical systems say no to naive composed OOP:
Machine learning libraries will often select the data layout (NCHW etc.) transparently, optimizing for cache locality.
Pinocchio, a robotics kinematics / dynamics library, has its functions access array data.
Drake, a larger robotics-oriented library, eventually has data in arrays below abstraction layers.
Unity DOTS stores all Transform data in packed arrays, not in GameObjects.
Box2D v3.0 switched from OOP bodies to ID-based handles with SoA storage.
Unreal Mass Entity is an ECS system for high-object-count scenarios.
Even if in an isolated example the performance gain seems small, these patterns occur so frequently that they can add up to large losses that are difficult to eliminate.
Thanks for reading! If you enjoyed this kind of full-stack analysis and root-causing, please share and subscribe for more posts on robotics, AI, and computing.
References and further reading
Code for demonstrations in this post, and more on github
“Better memory representation” in Jeff Dean’s “Performance Hints”
“Efficiency with Algorithms, Performance with Data Structures” - Chandler Carruth [CppCon 2014]. Note: I don’t fully agree with the statement (10:45) that “efficiency is only affected by algorithms” - a good example is the energetic cost of moving a byte from DRAM -> core being significantly higher than from L1, meaning the same algorithm with poor cache performance actually consumes more energy, in addition to completing slower.
Data-Oriented Design and C++ - Mike Acton [CppCon 2014]
Explicit cache control via software prefetching
 | A guest post by
|
This is some really great analysis, very impressive!
The "AMD spike" is very interesting. It's possible that their prefetch policy varies based on the delta between cache line accesses:
- At stride 16, we have a cache line delta of 1 (basically every access is on an adjacent cache line)
- At stride 32, we have a cache line delta of 2
Between these, it might just be using a simple prefetch scheme that always fetches adjacent cache lines - so you would end up with a many wasted pre-fetches.
Beyond 32, when the misses are never seen on adjacent cache lines (delta >= 2) they might be using a more advanced prefetch scheme (stride based, etc.) - that might improve the runtime.
They talk a little about prefetching in this document - https://docs.amd.com/v/u/en-US/58455_1.00
(This still doesn't convincingly talk about what I described - I'm guessing as well)
By the way, have you considered trying to disable the hardware prefetcher? (I think you can do it from the BIOS settings) That might give more predictable results.
Another interesting result could be to try __builtin_prefetch() GNU extension (https://www.daemon-systems.org/man/__builtin_prefetch.3.html) - I don't know if this would be better than the "warmup" runs that you have tried.
But great work overall! Had fun thinking through this.
This is fascinating! Thank you 🙏